See-TCP/IP creates graphical and tabular reports on a Windows/XP PC with network access to the z/VSE system.
Network Management and Monitoring
See-TCP/IP
Performance Monitor for VSE & TCP/IP
Platform: z/VSE
See-TCP/IP allows you to analyze the activity and performance of your z/VSE and TCP/IP systems from an easy-to-use PC graphical user interface.
See-TCP/IP answers questions like:
- What is the current CPU usage of my z/VSE system?
- What was CPU usage yesterday at 3:00 pm?
- What was the CPU trend for the last two months?
- Which partitions are using the most resources?
See-TCP/IP collects
- VSE Turbo Dispatcher Statistics
- CPU waiting-for-work time
- CPU non-parallel busy time
- CPU parallel busy time
- CPU overhead from other LPARs or VM
- VSE System Statistics
- Start subchannel requests
- I/O interrupts
- Phase loads
- SVC usage
- Program checks
- External interrupts
- VSE Partition Statistics
- Jobname, stepname
- Start I/O counts
- CPU usage
- TCP/IP Statistics
- Graphical display of overall IP activity
- Detailed information on active connections
- IP address
- Local and foreign ports
- Bytes sent and received
- Retransmits
- SWS silly window
- Current and maximum window sizes
- Historical Reporting
- Stored in SQL database
- With graphical display
- Provides trend analysis
- See-TCP/IP can be used to
- Graph overall IP datagram activity real-time
- Show IP datagram activity by Telnet, FTP, HTTP, and any other local IP applications running on z/VSE
- Identify foreign IP addresses connected to z/VSE
System Requirements
- CSI’s TCP/IP for VSE (does not run on other TCP/IP stacks)
- PC running Windows 2000 or above on a network that can access the z/VSE system
See-TCP/IP is an optional TCP/IP for VSE add-on. Request a free trial below.
To set up See-TCP/IP, please see the TCP/IP for VSE Optional Features Guide which can be found on the TCP/IP for VSE Documents page.
See-TCP/IP Screens
See the screen shots below.

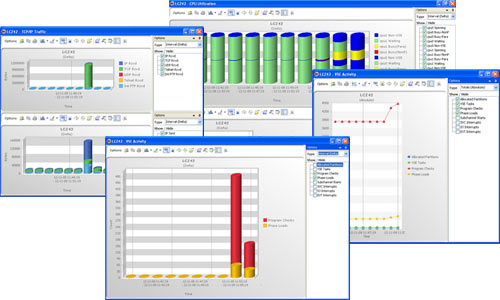
See-TCP/IP generates graphical reports of various kinds; for example, line graphs and bar graphs.
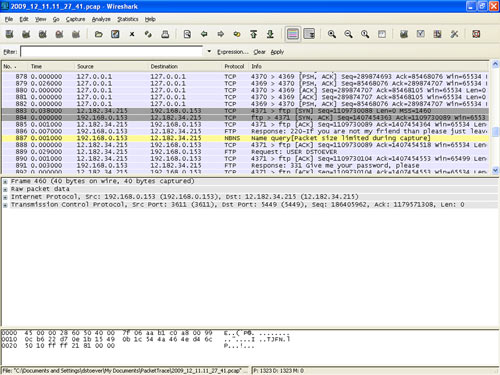
See-TCP/IP collects IP datagrams and sends them to Wireshark, which then displays the information.
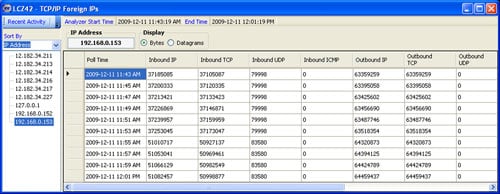
See-TCP/IP can create tabular reports that show IP connections into z/VSE.